

As we come up with ever more complicated ways of performing measurements, keeping track of all your measurements, their corrections and analyses is going to be tough. At the moment, I am thinking about how to do this for the upcoming beamtime and at my new position. The result shows signs of a database system again.
Intelligent organisation of measurement datafiles would be extremely helpful to groups doing SAS. Example queries –allowing us to trace back instrument failures or sample deterioration, for example– would be:
- show all corrected data of glassy carbon from all instruments between January and June,
- show all measurements done by this user after 18:00,
- show all measurements of water which used a 1.5 mm capillary sample holder, and a 1 mm second pinhole,
- show the shelf-life of all powder-like samples from clients from this institute that have been measured,
- show all the instruments that sample X has been measured on
You can imagine doing this in a (rather sizeable) Excel table, requiring a lot of columns to be filled in every sample we measure to account for all measurement details. Or we can use a database, to split this up into smaller information tables which can then be combined with a minimum of (duplication of) effort.
Such a management program would (if set up correctly) vastly simplify our life and allow us detailed access to all our measurements throughout history.
One example of such a management system (more geared towards tracking of surface deposition samples) is JuliaBase (code). This follows a quite similar concept, and I am looking into whether it is easier to adapt that to suit the measurement database purposes, or to write one’s own project (“Does what you want”, or “programmed by someone else”: pick one).
Before we can set up such a thing, we need to take a look at how a measurement and subsequent steps are done, what items need to be grouped in what groups, and how these items can be used later on.

This drive to start such organizing only re-materialized very recently, due the recent developments in the Imp2 code. Besides cleaning that code, I also ended up changing the way the data corrections are separated and defined. The thoughts that led to this are:
- A single measurement may serve different purposes. It must be possible to process the same measurement in different ways (i.e. using different processing pipelines) without much reconfiguration. See Figure 1 for the complete correction schemas in order of process.
- Multiple measurements may be done on the same sample, we need a way to group these measurements, for example using tags or other metadata. This way, multiple measurements can be recombined at a later stage to form a single dataset. Indeed, there are many ways in which measurements can be grouped, and we do not have to limit ourselves to a particular series or grouping sequence.
- Data from different instruments and instrument configurations should be accessible from the same database
- The database can furthermore link measurements to analyses performed therewith, and indeed couple analyses to one or more reports.
The information groups that I can imagine are:
- A measurement group where measurements are combined based on a query
- A measurement, defined by a measurement file and linked to the following:
- Instrument information (responsibles, serial numbers, age)
- Instrument configuration information (pinhole positions, etc.)
- Instrument options (temperature stages, chillers, optional beam intensity monitors, detachable robotics)
- Sample holder information (capillary, bracket, plate, etc.)
- Sample information (owner, disposal information)
- Operator information (allowing operator groups for synchrotron experiments)
- Client information (shipping, billing address)
- Data analyses, and
- links to reports.
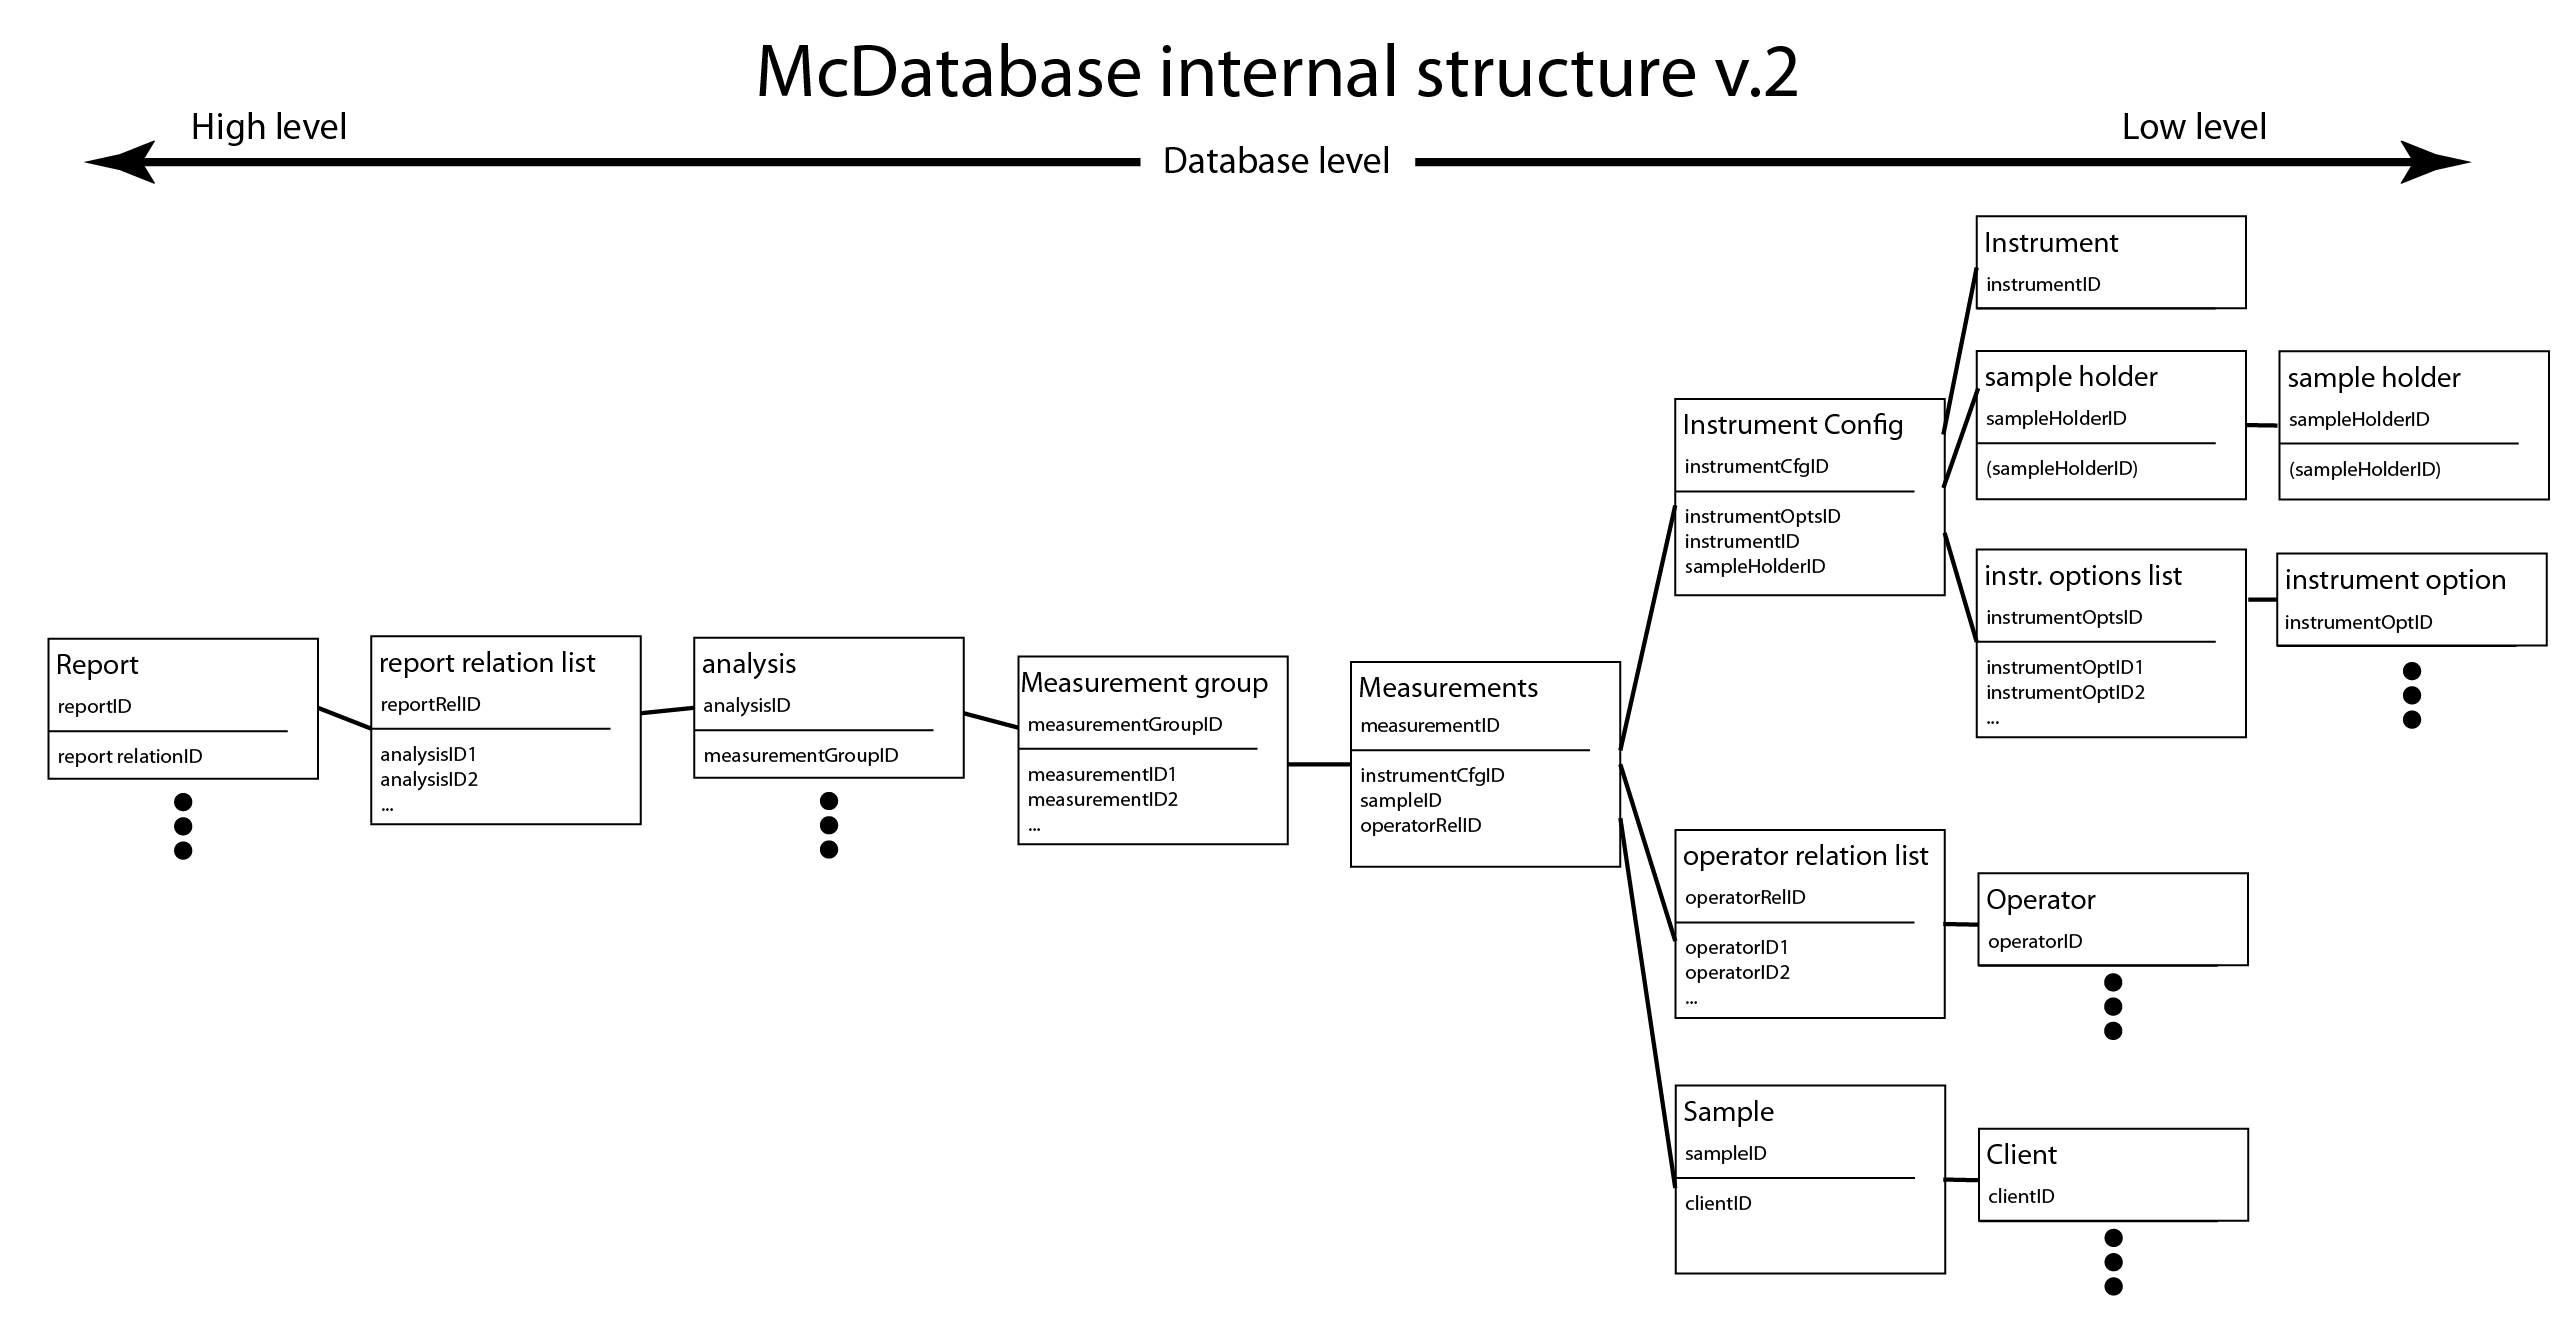
My partner, a database consultant, advised to also indicate the relationship between the smaller, master databases to the transactional databases (which link the items only). The database design follows roughly from there (Figure 1.5). At the moment, I am trying to decide between different database approaches: a table-based approach (SQLite, PostgreSQL) or a document-based approach (MongoDB). Advice is always welcome…
One could ask: “this sounds like an amazing amount of work, and is all that really necessary?”. However, after setting it up, maintaining the database should only take a minimum of effort (as most information in the database does not change). All you need to do to define a measurement is to select for a measurement: a client, operator, instrument, configuration, sample and instrument option(s). That is just six things to fill in, many of which can be done using pull-down menus (and barcode or RFID scanners for the really lazy people like me).
Apropos: to make that a bit more fun than just clicking a mouse, one could even consider using something I saw at an exhibition booth one day. There, the database items were combined by throwing physical (RFID-tagged) tokens into a bowl. This idea is explored for use by children here (and in more detail here).
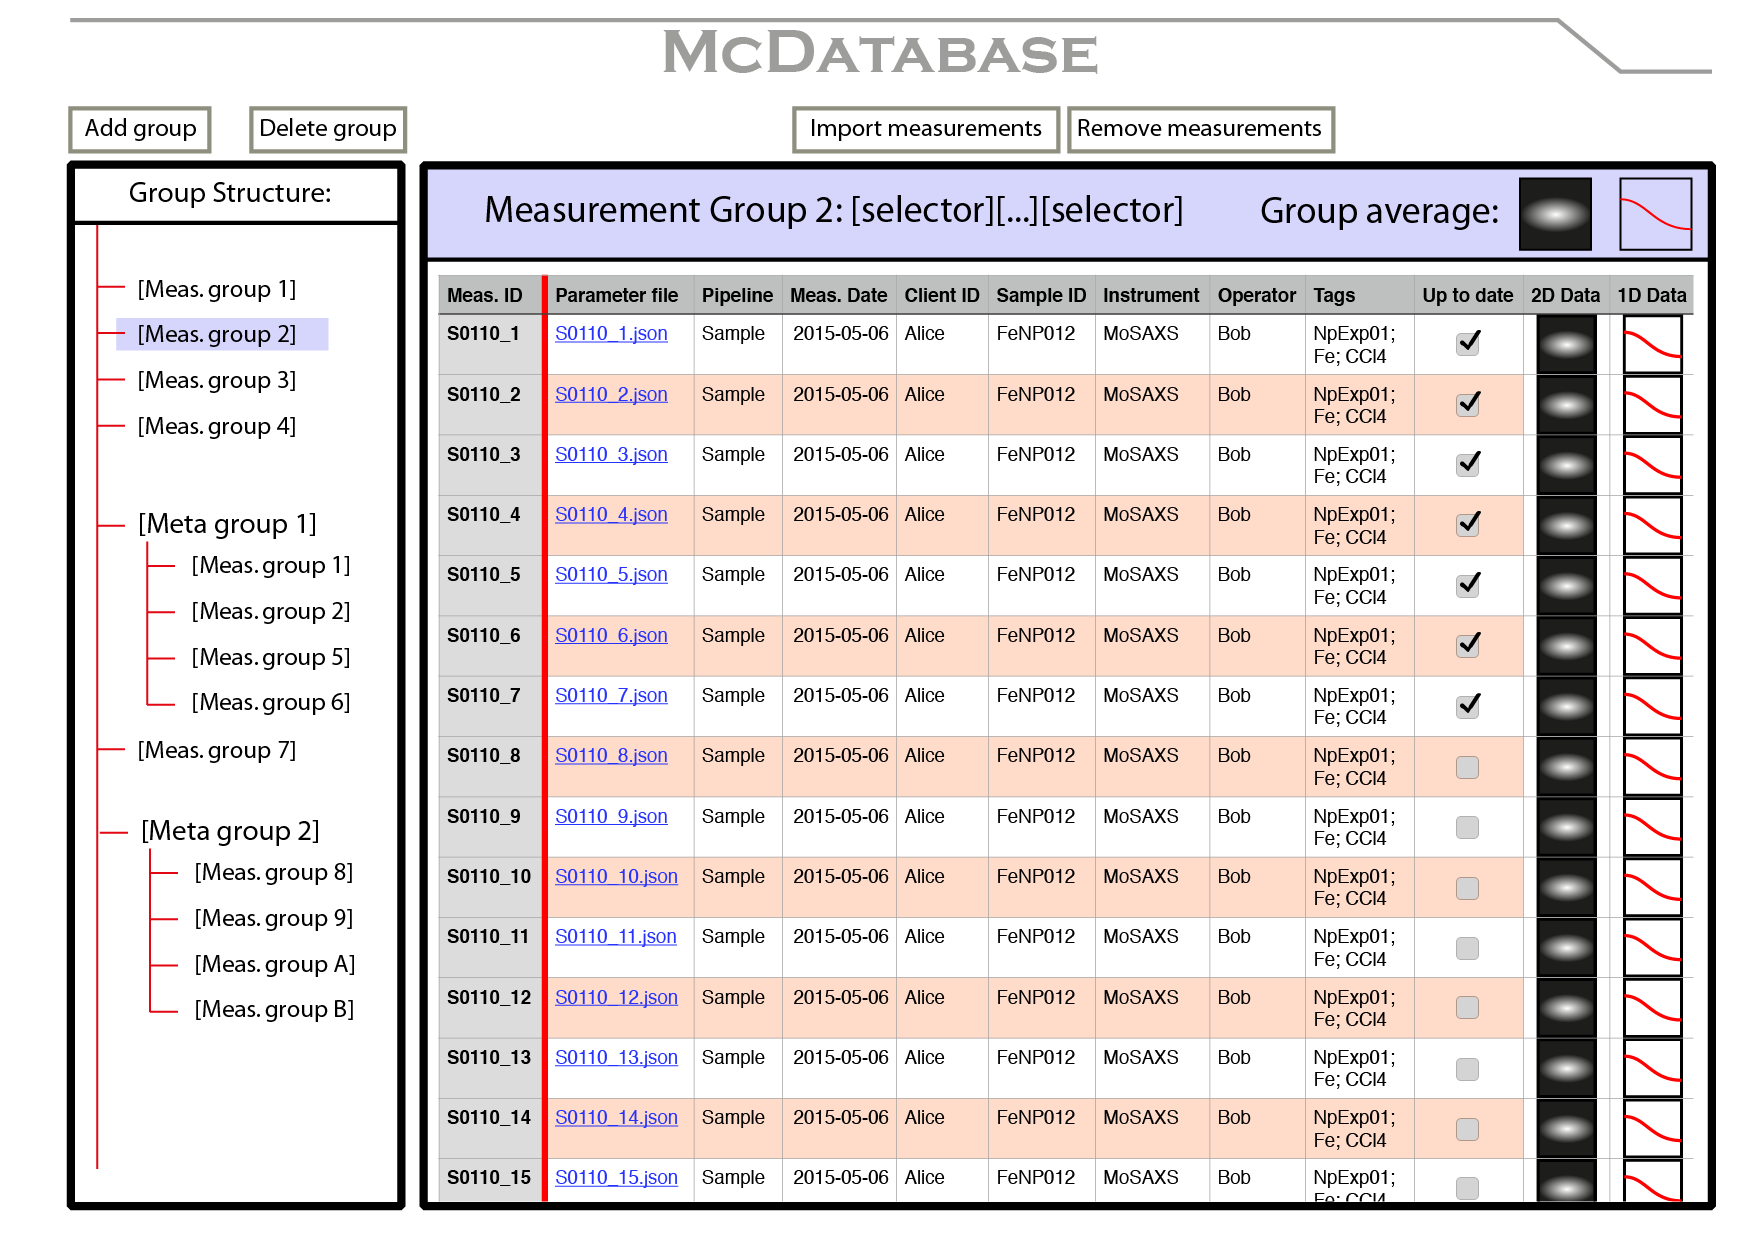
The concept measurement management program would then look like the mock-up shown in Figure 2. It would allow access to the configuration parameter files and the corrected data (both 2D images and 1D images). It would offer methods for selecting measurements from the database based on the database fields, and grouping the results from that search (perhaps meta-groups would also be of interest).
Interestingly, this resembles the measurement database that I created during my Ph.D. (Figure 3). While that one was written in an untenably messy fashion (and only did rudimentary corrections), it did prove its worth during that time and much simplified finding and organizing of measurements.

Right now, the data correction methods seem to work fine again. These methods have been written in such a way that integration into such a GUI should be a straightforward task (with the main GUI item being a standard list, listing the details in small information files: one per measurement). I hope that I can manage to get some people interested in joining me to program this in Python, once I set up a collection of test files. Stay tuned for updates!
Leave a Reply