

A while ago I stumbled across the Nomogram idea. A Nomogram is a graphical way of displaying mathematical relationships. I managed to construct one of these for converting “diffractionistas” to proper SAXS units…
According to the Elders, nomograms used to be quite common for estimating or calculating values for engineering, military, aviation and maritime applications. They are closely related to the sliderule, which also uses sliding, proportional scales to allow the calculation of related values, and are still in use today (at least in aviation) for quick calculation of corrections when all else fails. The nomogram, however, has become a rarity (i.e. I’ve never seen one in the wild).
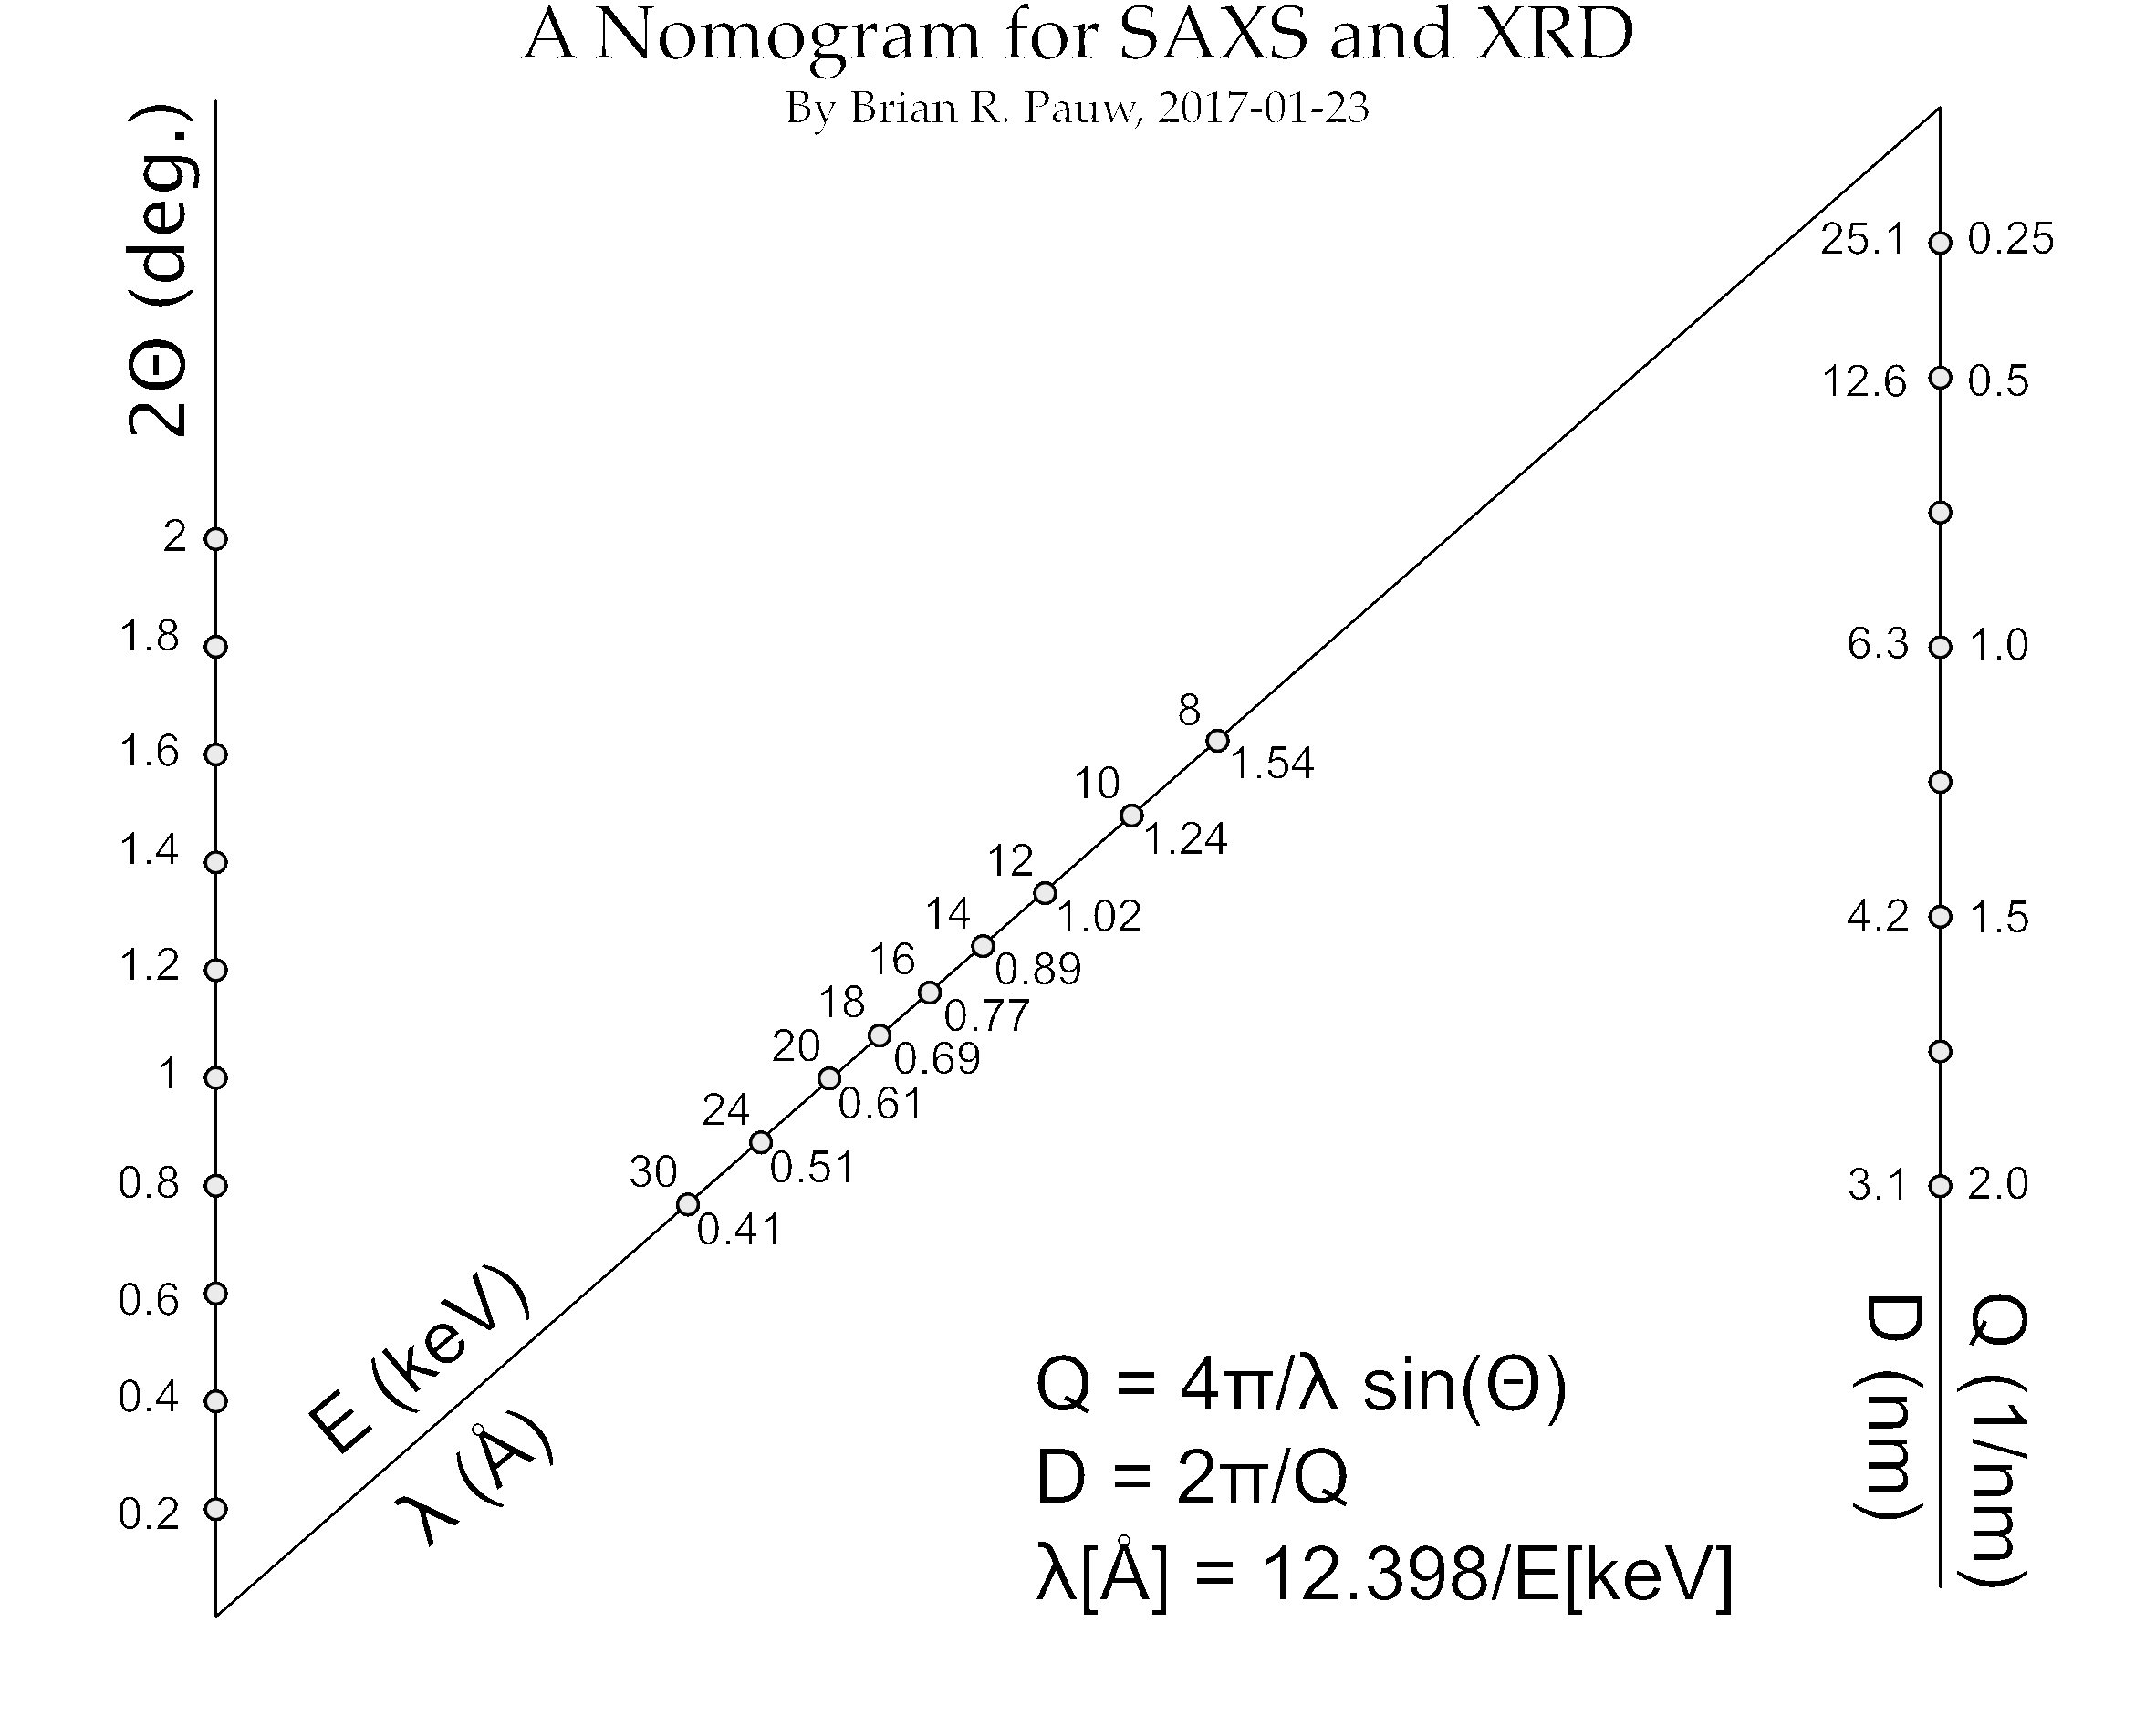
A year ago, while on a Christmas holiday, I’ve been toying with the idea of making one. Recently, I found that previous effort, and finally finished it: a Q nomogram. This one effortlessly converts between two-theta, wavelength / energy, and Q / D. It therefore has three relationships merged into one, hopefully making it quite handy. The nomogram immediately shows the effects and implications of shifting energy (handy for beamlines), and translates Q to D in a glance. It is perfect for explaining to diffractionists why Q is a much better scale than two-theta (or shudder converted-to-copper-two-theta).
The way you use it, is by drawing a straight line between two knowns, and extracting the third unknown from the intersect. So, by drawing a line between Q=1.0 (1/nm), and an energy of 8 keV (about that of copper k
Apropos, yes, you did see me use D for the diameter, or general distance there, rather than the radius R. After some thought, I’ve concluded that it’s more practical to use D in SAXS, since it specifies distances that more easily translate to non-spherical shapes and structures. It’s also a more common unit in our compatriot fields of SPM and TEM, so we might find better understanding of our results there.
The Nomogram was drawn by hand by me, which is probably not the best way to do it. According to the books, you should determine the axes and axes positions more mathematically, but I didn’t have the time to find out how (and in particular how to draw them, using Python/Matplotlib or something). If you know how, or if you have other improvements, please let me know. Now, I don’t expect nomograms to make a comeback, but I’d be very chuffed if I see this one on a beamline in the near future. Download it in PDF here.
Now the discussion can begin on nm^-1 vs Å^-1….
Well, I thoughtfully included both Ångström as well as nm. However, while the Ångström is condoned, only the nm is truly SI. In my code, however, I always use m and 1/m for every (reciprocal) length unit. That prevents all those nasty conversion factors throughout, in particular when calculating in absolute units.
Hey Brian,
Just wow, that really is a handy way of representing the relation between q and 2θ and I think as mandatory in a X-ray lab as the periodic table of elements in a chemistry lab.
Furthermore, I am really fond of your chosen energy/wavelength range since it is covering most of the anode materials and synchrotron wavelengths in one scheme so I wouldn’t be very much surprised if your nomogram really would find its way into many beamlines and X-ray labs.
Also the linear extension of the q and 2θ range (with your scheme as a heart-piece) to higher values of q and 2θ is rather straight forward, thanks a lot for sharing your work!
Best wishes
Heike
PS: Just reading the “lost art of nomograms” and omg!!! a pV=nRT nomogram, love it <3
Thanks, Heike, for the positive comments. I hope to one day be able to put proper axes in place, but PyNomo isn’t Python3 compatible…