

[update 7th of September: intensity units on the graph have been corrected]
Synchrotron staff have known for years, but collaborations really drive progress. Since first light on the MAUS at the start of this year, we have had a steady stream of collaborations both with internal researchers as well as outstanding external researchers, in addition to our own research projects. We have been deliberately encouraging and searching for such collaborations as they force us to innovate and improve. Here’s one shiny example of what collaborations did for us…
The MAUS was built for flexibility, with two sources (with copper and molybdenum targets), a detector that can move anywhere, and drop-and-measure breadboards that allow for extremely fast changes between different sample environments. It can measure liquids, solids and even surfaces with our new (tiny) hexapod.
A basic management system was put together with the help of our dedicated instrument scientist Glen Smales, that allows us to track projects, configurations and measurements. This requires users to fill in a short form describing the experiment and their samples, which is then linked to the individual measurements. Measurements are logged in an electronic logbook, which is automatically converted to a measurement script that ensures that all required information is measured (beam centre, flux, and transmission in particular).
Data corrections are constantly being perfected in DAWN through our close collaborations with Tim Snow at I22, and Jacob Filik, Mark Basham, and others in the Diamond Scientific Software group. This now means that the same data corrections are done at their I22 beamline as are done in our laboratory, greatly improving comparability.
But all this would be useless without samples. We have our own research and reference materials projects running, but they would still leave a significant fraction of measurement time empty. Furthermore, measuring the same type of samples ensures that you never get to test your methods for universality, and that your capabilities are never pushed beyond the known. Collaborations also make you learn, for example how to calculate the peak positions for the different planes of a 2D hexagonal array of cylinders.
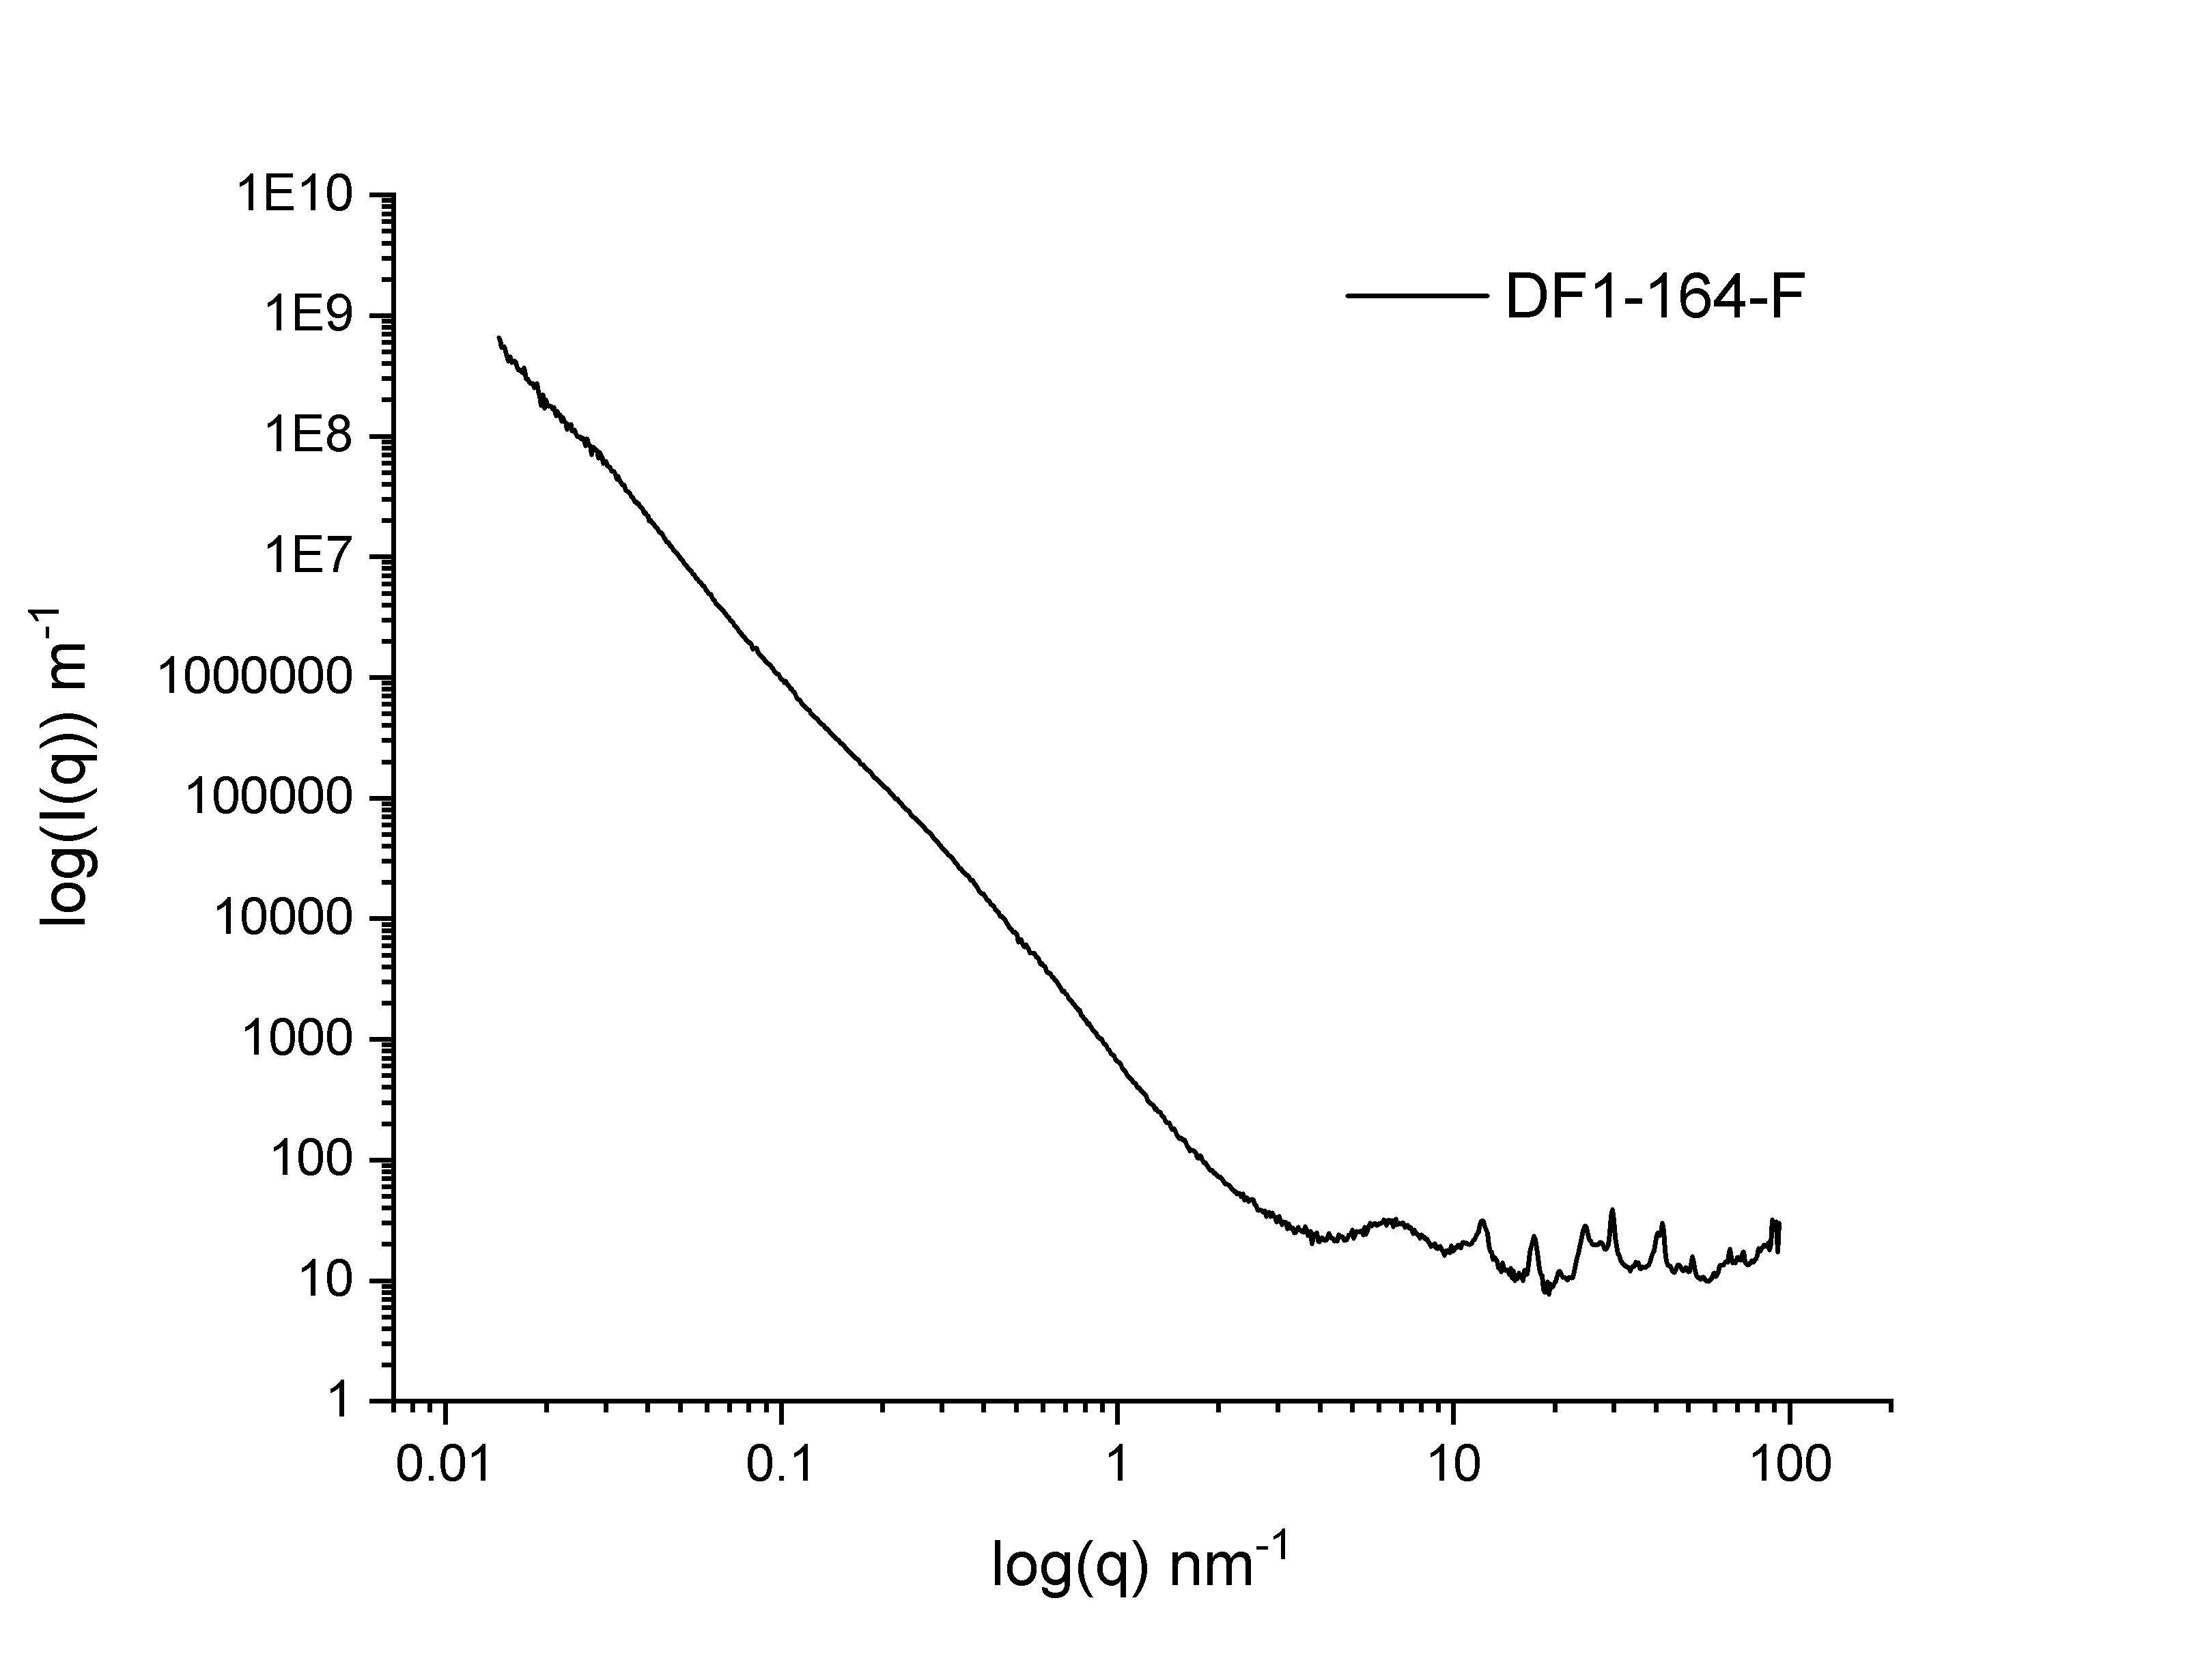
To scale the intensity to absolute units, we estimated an effective thickness using the measured transmission factor (ignoring, for the moment, its porosity), and the composition of the sample. The fluorescence was solved by composing the final dataset from measurements with two sources: while the low-Q region is using the copper-source measurements, the high-Q region was measured with the molybdenum X-ray source, now giving us the diffraction peaks otherwise hidden below the fluorescence. As a bonus, the high energy of the molybdenum radiation allowed us to push the maximum Q to almost 100 1/nm, bringing our total range to almost four decades! Due to the thorough data corrections, no additional scaling or overlap matching was necessary. Measurement time for all the datasets that comprise this data took about 7 hours.
These collaborations, then, force us to continually improve the quality of our work, resulting in beautiful data along the way. Apropos, I think this data may contain one of the few XRD patterns that has been properly background subtracted, is in absolute units, and has uncertainties on each datapoint… So, if you have an interesting project that you think will help push us beyond our limits, drop me a line and let’s see if we can collaborate!
Leave a Reply